Image Details
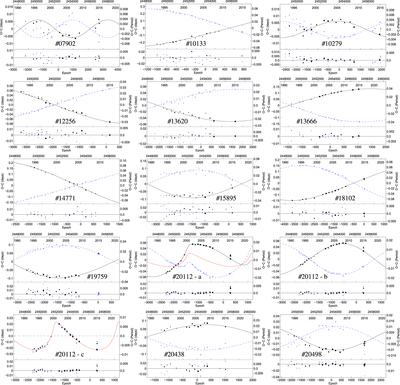
Caption: Figure 2.
O – C diagrams for the times of minimum of the analyzed systems. The continuous and dashed curves represent predictions for the primary and secondary eclipses, respectively. The individual primary and secondary minima are denoted by dots and open circles, respectively. Larger symbols correspond to the more precise measurements. The bottom plots represent the residuals after subtraction of the fit.
Other Images in This Article
Copyright and Terms & Conditions
© 2015. The American Astronomical Society. All rights reserved.
Copyright ©
2025 Astronomy Image Explorer. All Rights Reserved.