Image Details
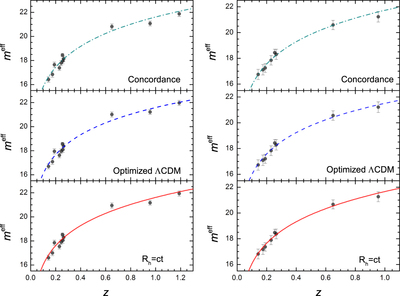
Caption: Figure 4.
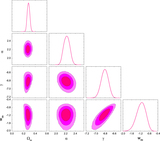
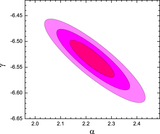
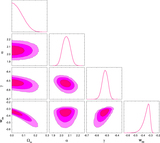
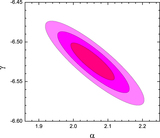
Hubble diagrams for SLSNe Ic. The effective apparent magnitudes of SLSNe Ic are plotted as solid points, together with their corresponding best-fit theoretical curves. Left: the effective magnitudes are calculated using the ﹩{\Delta }{{M}_{30}}﹩ decline relation. Right: the effective magnitudes are calculated using the peak magnitude–color evolution relation.
Other Images in This Article

Copyright and Terms & Conditions
© 2015. The American Astronomical Society. All rights reserved.
Copyright ©
2025 Astronomy Image Explorer. All Rights Reserved.