Image Details
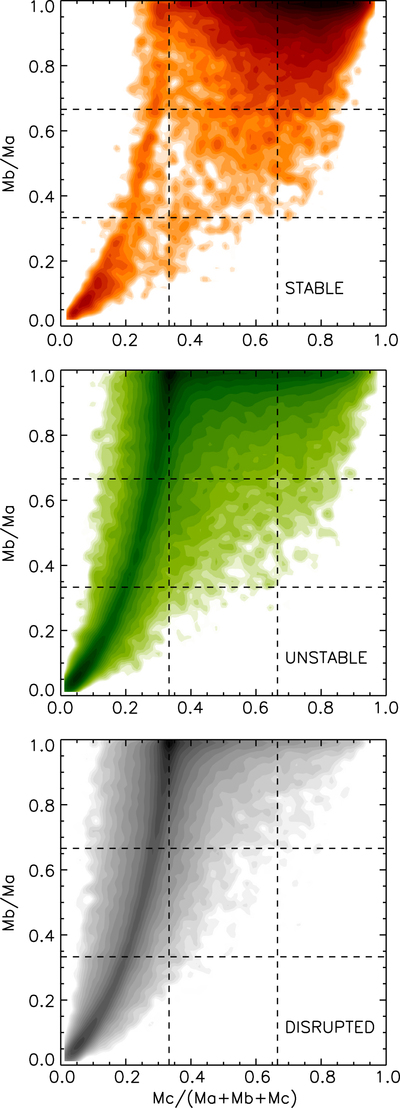
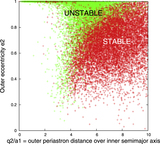
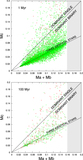
Caption: Figure 14.
The location of the 15,524 stable, 62,609 unstable, and 121,867 disrupted systems in the triple diagnostic diagram at an age of 1 Myr. Since all triple systems in these simulations were started out with three identical bodies, the original systems were all located at the point (0.333,1.000). Their final location is determined by their dynamical evolution and resulting accretion. Evidently the resulting triple systems do not populate the triple diagnostic diagram uniformly, but they have clear preferential locations, with important differences for the stable, unstable, and disrupted systems. The plots show smoothed surface density of points on a logarithmic intensity scale. Viscous interactions are not included in these simulations, and so observations may find triple systems outside these distributions.
Other Images in This Article
Show More
Copyright and Terms & Conditions
© 2015. The American Astronomical Society. All rights reserved.