Image Details
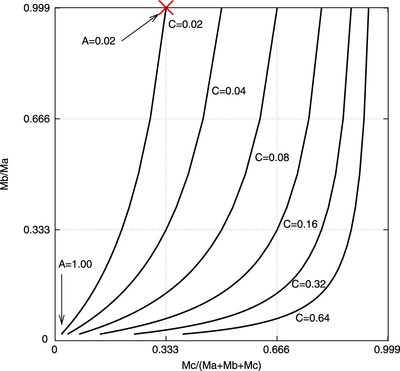
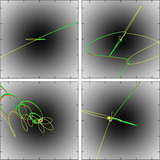
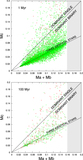
Caption: Figure 12.
Evolution of triple systems with accretion in the triple diagnostic diagram. Note that since both axes of the diagram are ratios, then all masses can be scaled up or down. Those listed show ranges for MA from 0.02 to 1 M⊙, MB has a fixed value of 0.02 M⊙, and six values for MC are shown, from 0.02 to 0.64 M⊙. The red cross indicates the starting position for three identical bodies.
Other Images in This Article
Show More
Copyright and Terms & Conditions
© 2015. The American Astronomical Society. All rights reserved.
Copyright ©
2025 Astronomy Image Explorer. All Rights Reserved.