Image Details
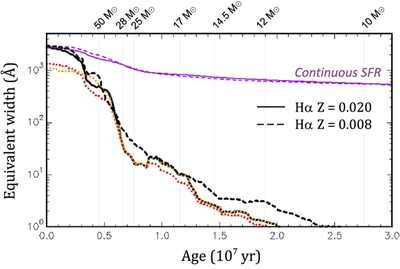
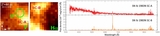
Caption: Figure 1.
Time evolution of a Hα EW, Starburst99 SSP. The single-burst model is represented by the black line and continuous star formation by the purple line; both use a standard Salpeter IMF with α = 2.35, M up = 100 M ☉. Dotted lines represent single-burst solar-metallicity models with different IMFs: red is for α = 3.30, M up = 100 M ☉, and orange is for α = 2.35, M up = 30 M ☉. The lifetimes of single stars of different initial masses at solar metallicity according to Padova models are indicated with vertical gray lines.
Other Images in This Article

Show More
Copyright and Terms & Conditions
© 2013. The American Astronomical Society. All rights reserved.
Copyright ©
2025 Astronomy Image Explorer. All Rights Reserved.