Image Details
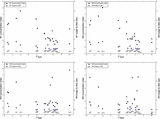
Caption: Figure 20.
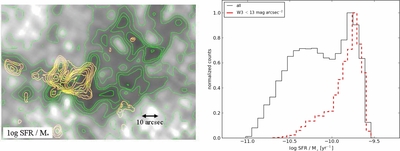
sSFR in the southwestern bar cusp of M 83. Left: the sSFR is derived from the W1 (stellar mass) and W3 (SFR) imaging. The green contours range from −10.5 to −9.75 for log SFR/ M * (yr −1). The orange contours correspond to the molecular gas (see Figure 13); right: histogram showing the sSFR distribution for the region. The red dashed line denotes the 12 μm high surface brightness knots: <13 mag (0.2 mJy) arcsec −2.
Other Images in This Article


Show More
Copyright and Terms & Conditions
© 2013. The American Astronomical Society. All rights reserved.
Copyright ©
2025 Astronomy Image Explorer. All Rights Reserved.