Image Details
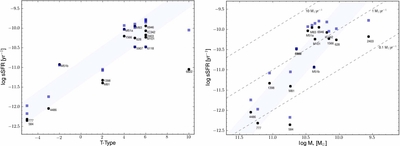
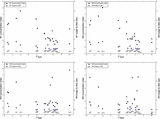
Caption: Figure 19.
sSFR compared to the Hubble type and stellar mass. The stellar mass is derived using the M/ L relation from this work (Equation (9)). Two global SFRs are shown: black points correspond to the SFR (22 μm; Equation (2)) and blue squares correspond to the combined IR+UV SFR. There is a similar linear trend (illustrated by the blue shaded regions) for both Hubble type and the host stellar mass. A range in SFRs (from 0.1 to 10 M ☉ yr −1) are represented by the dashed lines.
Other Images in This Article


Show More
Copyright and Terms & Conditions
© 2013. The American Astronomical Society. All rights reserved.
Copyright ©
2025 Astronomy Image Explorer. All Rights Reserved.