Image Details

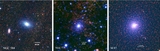
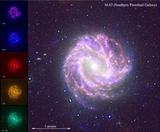
Caption: Figure 14.
Many faces of M 83, highlighting the evolution from gas to stars. The 10′ panels show: the neutral (H i gray scale) and molecular hydrogen (CO contours) gas content, massive star formation as viewed by GALEX NUV (gray scale) and FUV (white contours), WISE view of 11.3 μm PAH emission ( W3 band) and reprocessed starlight ( W4 band) both associated with star formation, and the center panel shows the stellar distribution of the previous generations of star formation as viewed with the W1 (3.4 μm; gray scale) and W2 (4.6 μm; white contours) bands. The CO(1–0) is from Crosthwaite et al. (2002).
Other Images in This Article


Show More
Copyright and Terms & Conditions
© 2013. The American Astronomical Society. All rights reserved.