Image Details

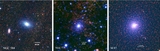
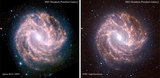
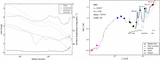
Caption: Figure 10.
WISE W3 comparison with GALEX NUV of M 83 (NGC 5236). The left panel shows a log-stretch of the WISE W3 image, the middle panel shows a log-stretch of the GALEX NUV image, and the right panel is the flux ratio between the two bands. Dark gray-scale values indicate strong NUV, while light values indicate relatively strong W3; e.g., the arrow points to high NUV and low W3. The nucleus is denoted with a × symbol.
Other Images in This Article


Show More
Copyright and Terms & Conditions
© 2013. The American Astronomical Society. All rights reserved.
Copyright ©
2025 Astronomy Image Explorer. All Rights Reserved.