Image Details
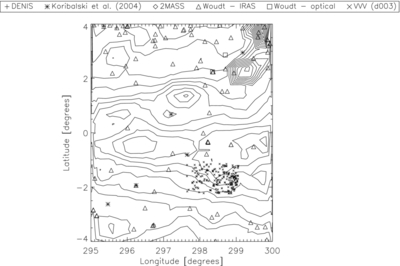
Caption: Figure 2.
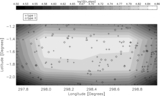
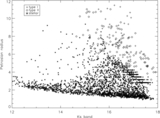
DIRBE/COBE emission map at 2.2 μm; each interval in the contour represents 0.5 MJy; galaxies observed by other surveys (see legend at the top) are large symbols; objects of the present work are represented by crosses in d003 tile centered at (ℓ, b) = (298.3558, −1.6497). References: DENIS (Paturel et al. 2005); 2MASS (Skrutskie et al. 2006); Woudt et al. (2001).
Other Images in This Article
Copyright and Terms & Conditions
© 2012. The American Astronomical Society. All rights reserved.
Copyright ©
2025 Astronomy Image Explorer. All Rights Reserved.