Image Details
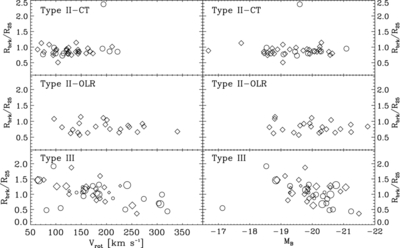
Caption: Figure 13.
Plots of break radius, in units of R 25, against rotation velocity (left column) and absolute magnitude (right column), plotted separately for Type II-CT, for Type II-OLR, and for Type III profiles. This plot uses data from the combined sample, including the early-type barred galaxies from Paper I and the late-type galaxies from PT06. Symbols are coded as follows: unbarred galaxies are circles, barred galaxies are diamonds; in the third row, small-size symbols are Type III-s profiles, medium-size symbols are III-d, and larger symbols are non-specific Type III profiles.
Other Images in This Article
Show More
Copyright and Terms & Conditions
© 2011. The American Astronomical Society. All rights reserved.
Copyright ©
2026 Astronomy Image Explorer. All Rights Reserved.