

Image Details
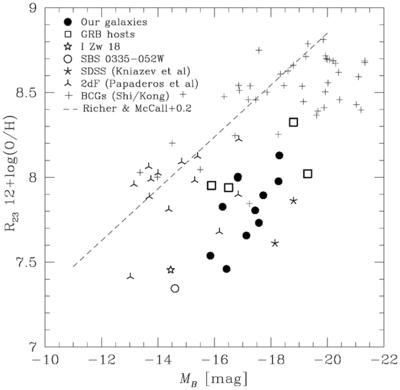
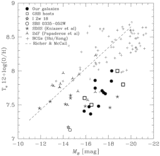
Caption: Figure 7.
Same as Figure 6, except we plot strong line metallicities calculated using R 23 McGaugh (1991). The strong line metallicities are systematically +0.2 dex larger than the T e metallicities, but the overall distribution remains the same: our sample of metal-poor galaxies and the GRB hosts are systematically offset from the Richer & McCall (1995) luminosity–metallicity relation (dashed line), which we shift by +0.2 dex for consistency.
Other Images in This Article
Copyright and Terms & Conditions
© 2008. The American Astronomical Society. All rights reserved.

Copyright ©
2026 Astronomy Image Explorer. All Rights Reserved.
