Image Details
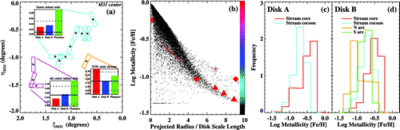
Caption: Fig. 2.
(a) Comparison of the minor‐axis contamination to observations. The G07 DEIMOS masks (rectangles) are grouped into inner minor‐axis masks, outer minor‐axis masks, and a single mask (f135) offset from the minor axis. The inset plots for each group show the ratio ﹩R_{m}﹩ of the strength of the GSS component to the peak of the GSS at the same ﹩R_{\mathrm{proj}\,}﹩; ﹩R_{m}﹩ is measured for our three runs as discussed in the text at 840 Myr into the runs. Observational estimates and ±2 σ error bars from K. M. Gilbert et al. (2008, in preparation) are plotted as horizontal solid and dotted lines. Clearly, the Plummer model contributes too much debris on the minor axis. (b) Star particle metallicities in the original, predisrupted satellite (black dots) versus radius normalized by the disk scale length. For comparison, observed results for M33’s disk stars are plotted in red: Stephens & Frogel (2002; square); linear approximation to points of Kim et al. (2002; straight line); Galleti et al. (2004; diamonds); McConnachie et al. (2006; cross); Barker et al. (2007; triangles). The color bar translates ﹩[ \mathrm{Fe}\,/ \mathrm{H}\,] ﹩ to the color scale of Figs. 1e and 1f. (c) Histogram of particle metallicity values in disk A within the core and cocoon regions marked in Fig. 1e. (d) Histogram of particle metallicity values in disk B within the core, cocoon, N arc, and S arc regions marked in Fig. 1f.
Other Images in This Article
Copyright and Terms & Conditions
© 2008. The American Astronomical Society. All rights reserved. Printed in U.S.A.