Image Details
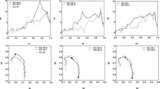
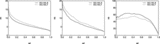
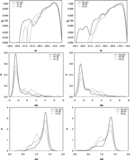
Caption: Fig. 8.
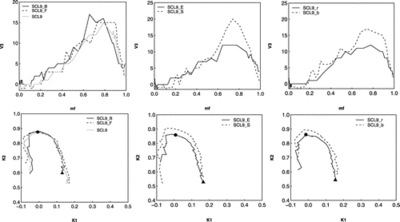
Supercluster SCl 9. Top panels: Minkowski functional ﹩V_{3}﹩ (the Euler characteristic) vs. the mass fraction ﹩m_{f}﹩ for bright (B, ﹩M\leq -20.0﹩) and faint (F, ﹩M> -20.0﹩) galaxies (top left), for early‐ and late‐type galaxies (top middle), and for red and blue galaxies (top right). Bottom panels: Morphological signatures ﹩K_{1}﹩ (planarity)–﹩K_{2}﹩ (filamentarity) for the same populations. Symbols as in Fig. 7.
Other Images in This Article

Show More
Copyright and Terms & Conditions
© 2008. The American Astronomical Society. All rights reserved. Printed in U.S.A.
Copyright ©
2025 Astronomy Image Explorer. All Rights Reserved.