Image Details
Caption: Fig. 4.
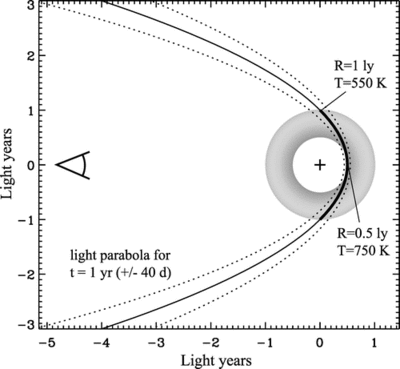
Possible geometry of the IR echo of SN 2006gy. The solid curve is the light parabola cone for a time ~1 yr after the luminosity peak, and the dotted curves are the corresponding parabolas for 40 days before and after that. The intersection of these curves and the circular shell represents the locus of points in the CSM that we see illuminated by the object’s high‐luminosity phase. The closest material illuminated is at a radius of 0.5 lt‐yr from the star. Material much farther away can be reached by the light cone, but in order to be hot enough to emit thermal radiation at ~2 μm, it cannot be much farther than 1 lt‐yr from the star. Thus, the thick part of the curve represents the probable location of the dust responsible for the IR echo of SN 2006gy, and the shaded thick circle represents the rest of a shell that is not illuminated by the SN but which may cause extinction along our sight line.
Other Images in This Article
Copyright and Terms & Conditions
© 2008. The American Astronomical Society. All rights reserved. Printed in U.S.A.