Image Details
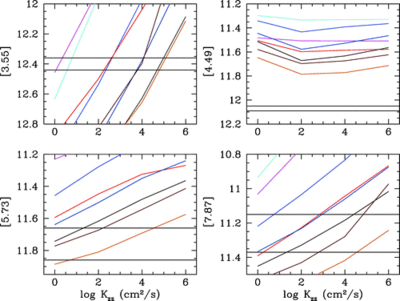
Caption: Fig. 5.
Absolute IRAC magnitudes for HN Peg B (range indicated by horizontal black lines), compared to synthetic photometry from our models as a function of vertical mixing diffusion coefficient ﹩K_{zz}﹩. For ease of plotting, ﹩K_{zz}=0﹩ has been plotted as ﹩\mathrm{log}\,K_{zz}=0﹩. The model values cluster in pairs of 1015 K (cyan to dark blue to gray) and 1115 K (pink to dark red to brown), with sedimentation parameter ﹩f_{\mathrm{sed}\,}=1﹩, 2, 3, and 4 from left to right for the [3.55] panel, and from top to bottom in the other panels.
Other Images in This Article


Copyright and Terms & Conditions
© 2008. The American Astronomical Society. All rights reserved. Printed in U.S.A.
Copyright ©
2025 Astronomy Image Explorer. All Rights Reserved.