Image Details
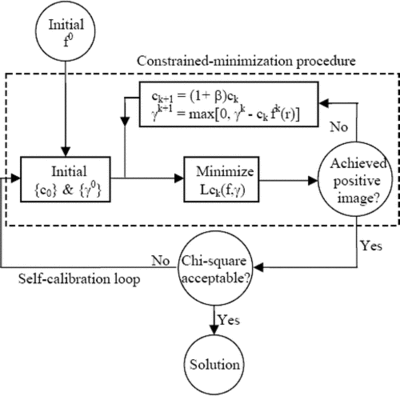
Caption: Fig. 8.
Flow chart of the image reconstruction algorithm. The dashed‐line rectangle encloses the constrained‐minimization procedure. The outer loop (outside this dashed‐line rectangle) represents the self‐calibration loop. As shown in this flow chart, the self‐calibration loop uses the most recent values of ﹩f( r_{j}) ﹩ as the initial values for ﹩f^{k}( r_{j}) ﹩, while setting ﹩\{ \gamma ^{k}\} ﹩ and ﹩\{ c_{k}\} ﹩ to initial values, namely, ﹩\{ \gamma ^{0}\} ﹩ and ﹩\{ c_{0}\} ﹩, respectively.
Other Images in This Article

Show More
Copyright and Terms & Conditions
© 2008. The American Astronomical Society. All rights reserved. Printed in U.S.A.
Copyright ©
2025 Astronomy Image Explorer. All Rights Reserved.