Image Details
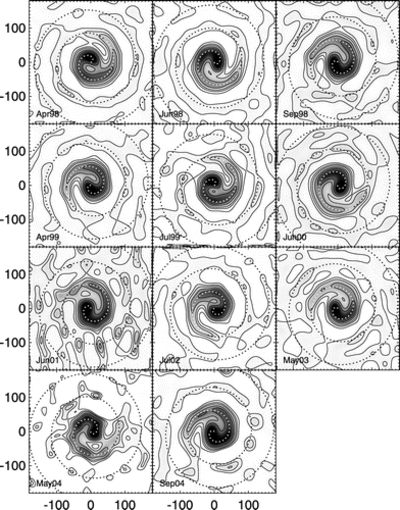
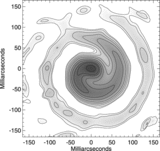
Caption: Fig. 1.
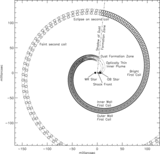
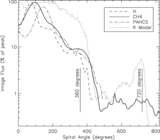
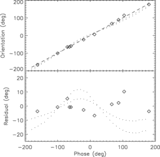
Images recovered from data in the CH4 filter over 11 observing epochs. Contour levels are 0.4%, 1%, 2%, 5%, 10%, and 50% of the peak. North (declination) is up and east (right ascension) to the left, with the image scale labeled in milliarcseconds. Images have been centered on the mathematical origin of the best‐fit Archimedean spiral model (dashed line; see text for details).
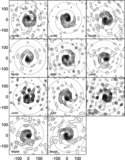
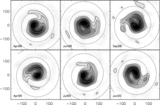
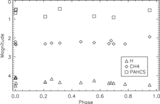
Other Images in This Article
Copyright and Terms & Conditions
© 2008. The American Astronomical Society. All rights reserved. Printed in U.S.A.
Copyright ©
2025 Astronomy Image Explorer. All Rights Reserved.