Image Details
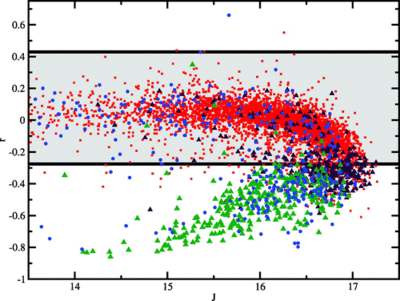
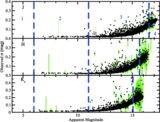
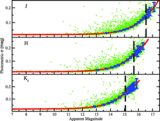
Caption: Fig. 15.
As a function of apparent magnitude for our ﹩\left|b\right|> 20^{\circ }﹩ sample, we plot the r‐correlation statistic between J‐band photometry and J‐band seeing. Nonvariables are shown as red squares and black triangles, the latter are identified as extragalactic by 2MASS, NED, or SDSS. Variables are shown as blue circles and green triangles, the latter are identified as extragalactic. Almost all of the identified extragalactic variables are extended and exhibit variability that is anticorrelated with seeing (see Fig. 14). This variability is not intrinsic to the source. The gray region corresponds to sources with photometry that is neither correlated nor anticorrelated with seeing variations. See § 3.5 for discussion.
Other Images in This Article
Show More
Copyright and Terms & Conditions
© 2008. The American Astronomical Society. All rights reserved. Printed in U.S.A.