Image Details
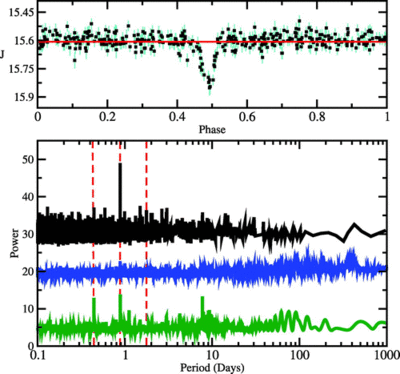
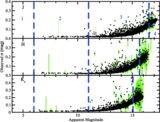
Caption: Fig. 12.
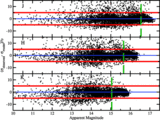
Top: J‐band Cal‐PSWDB data for 2MASS J04261603+0323578 folded to a period of 0.8832 days. Data are shown in black, with 1 σ error bars in teal. Each data point corresponds to the unweighted average of one group of six scans (﹩m_{n,t_{6}}﹩). The mean apparent magnitude is shown with a red horizontal line. Bottom: Periodograms for 2MASS J04261603+0323578, calculated from J‐band Cal‐PSWDB data. Before applying a relative offset for clarity, all periodograms have been shifted to a mean of 0 and normalized to a standard deviation of 1. Black: our algorithm ﹩( 1/ \chi ^{2}_{25}) ﹩. Blue: Box least squares. Green: Lomb‐Scargle. Periods are on the horizontal axis in days, and the corresponding periodogram power is on the vertical axis. Overlaid are dashed vertical red lines at 0.4416, 0.8832, and 1.7664 days: half the period, the period, and twice the period discovered for this periodic variable. See § 3.4.3 for discussion.
Other Images in This Article
Show More
Copyright and Terms & Conditions
© 2008. The American Astronomical Society. All rights reserved. Printed in U.S.A.