Image Details
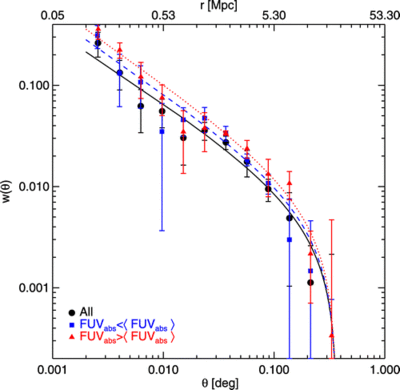
Caption: Fig. 6.
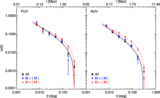
Angular correlation function of the CFHTLS subsamples cut in absolute UV magnitude: ﹩M< \langle M\rangle ﹩ is shown by squares, and ﹩M> \langle M\rangle ﹩ is shown by triangles; for comparison, the total sample (circles) is shown. The curves show the best‐fit power laws with the integral constraint correction terms subtracted. The upper axis shows the comoving scales corresponding to angular scales at ﹩z=0.9﹩.
Other Images in This Article
Show More
Copyright and Terms & Conditions
© 2007. The American Astronomical Society. All rights reserved. Printed in U.S.A.
Copyright ©
2025 Astronomy Image Explorer. All Rights Reserved.