Image Details
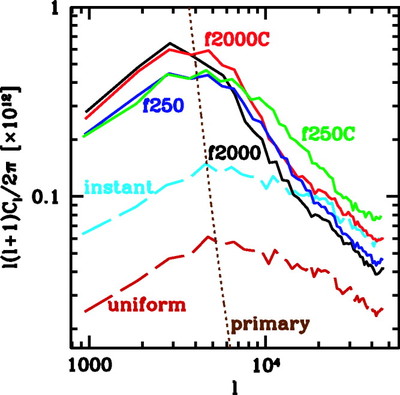
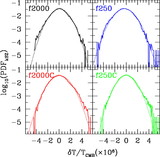
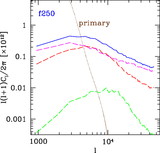
Caption: Fig. 4.
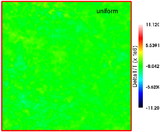
Sky power spectra of ﹩\delta T_{\mathrm{kSZ}\,}/ T_{\mathrm{CMB}\,}﹩ fluctuations resulting from our simulations: f2000 (black line), f250 (blue line), f2000C (red line), and f250C (green line). For comparison, we also show the results from simple models which utilize the same density and velocity fields as the actual simulations, but different assumptions about the gas ionization in space and time: a uniform reionization with the same reionization history as in simulation f250 (dashed dark red line) and an instant reionization model with the same integrated optical depth ﹩\tau _{\mathrm{es}\,}﹩ as in simulation f250 (dashed cyan line). The primary CMB anisotropy signal is also shown (dotted brown line).
Other Images in This Article

Show More
Copyright and Terms & Conditions
© 2007. The American Astronomical Society. All rights reserved. Printed in U.S.A.