Image Details
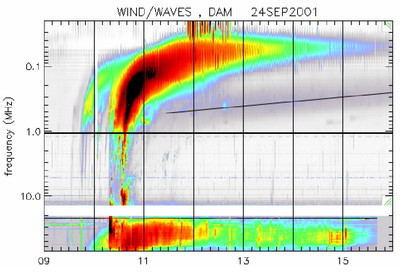
Caption: Fig. 1.
Combined radio spectrum of the 2001 September 24 event using DAM (between 20 and 70 MHz) and WAVES (<14 MHz). Both the high‐ and low‐frequency continua are clearly visible on this plot. The black line is hand drawn to approximately indicate the frequency drift of the low‐frequency continuum.
Other Images in This Article
Copyright and Terms & Conditions
© 2007. The American Astronomical Society. All rights reserved. Printed in U.S.A.
Copyright ©
2025 Astronomy Image Explorer. All Rights Reserved.