Image Details
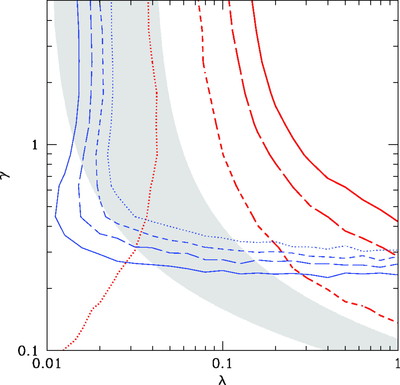
Caption: Fig. 2.
Parameters of the reddening distribution of strong Mg II systems. Thick and thin curves respectively mark the set of parameters for which the observed abundance of absorbers and the fraction of very reddened lines of sight match the SDSS values. Solid, long‐dashed, short‐dashed, and dotted lines refer to ﹩dN/ dz=0.90,\, 0.66,\, 0.49,\ \mathrm{and}\,\ 0.35﹩ (i.e., to 0, 1, 2, and 3 σ Poissonian fluctuations in the counts of GRB absorbers), respectively. The shaded area is bounded by the loci where the median observed color excess ﹩\lambda [ \mathrm{ln}\,( 2) ] ^{1/ \gamma }﹩ is 0.01 (lower boundary) and 0.04 (upper boundary). Models for which thin and thick curves of the same type cross within the shaded area are consistent with all the observational constraints.
Other Images in This Article
Copyright and Terms & Conditions
© 2007. The American Astronomical Society. All rights reserved. Printed in U.S.A.