Image Details
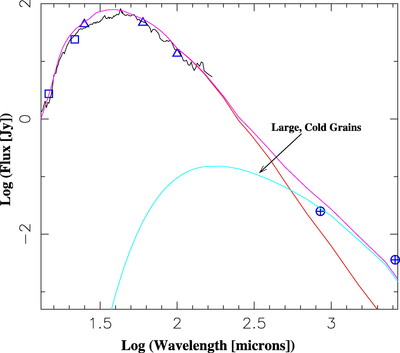
Caption: Fig. 11.
Observations (black curve: ISO spectra; blue symbols: photometric data (circled crosses: SCUBA on JCMT 0.88 mm and OVRO 2.6 mm; squares: MSX; triangles: IRAS; and magenta curve: model spectrum) of I 19475. Individual components of the model are also shown: warm (red) and cold (cyan) shells. The warm shell represents the best fit model from Sarkar & Sahai (2006) derived to fit the observed SED out to ~200 μm, and the cold shell represents the large‐grain emission component derived to fit submillimeter and millimeter continuum data.
Other Images in This Article


Copyright and Terms & Conditions
© 2007. The American Astronomical Society. All rights reserved. Printed in U.S.A.
Copyright ©
2025 Astronomy Image Explorer. All Rights Reserved.