Image Details
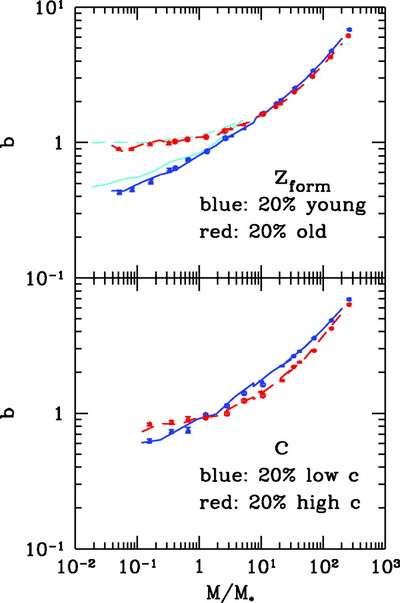
Caption: Fig. 2.
Bias factor of dark matter halos as a function of the halo mass. In the top panel, we show the dependence on the halo formation epoch, with the symbols in red being for the oldest 20% of halos and those in blue being for youngest 20% of halos. The cyan lines are the results of Gao et al. (2005), for comparison. The bottom panel shows the dependence on the halo concentration, with the red and blue colors being for those with the highest and lowest 20% of concentrations, respectively. The open triangles, open circles, filled triangles, and filled circles are from the simulations of boxsize 300, 600, 1200, and ﹩1800\ h^{-1}\ \mathrm{Mpc}\,﹩, respectively. The solid and dashed lines are not the lines connecting the data points, but are for the results of young (or less concentrated) and old (or more concentrated) halos, respectively, estimated for a very narrow mass bin, ﹩M\pm 0.1M﹩.
Other Images in This Article
Copyright and Terms & Conditions
© 2007. The American Astronomical Society. All rights reserved. Printed in U.S.A.