Image Details
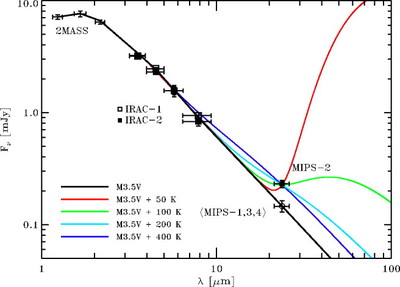
Caption: Fig. 5.
Spectral energy distribution for the unresolved photometry of the cataclysmic variable and the line‐of‐sight foreground M dwarf. An M3.5 V dwarf template, scaled to the 2MASS J‐band photometric point, is shown in black. The "high‐state" MIPS‐2 data point is also shown, with four different blackbody curves forced to fit the MIPS‐2 data point.
Other Images in This Article

Copyright and Terms & Conditions
© 2006. The American Astronomical Society. All rights reserved. Printed in U.S.A.
Copyright ©
2025 Astronomy Image Explorer. All Rights Reserved.