Image Details
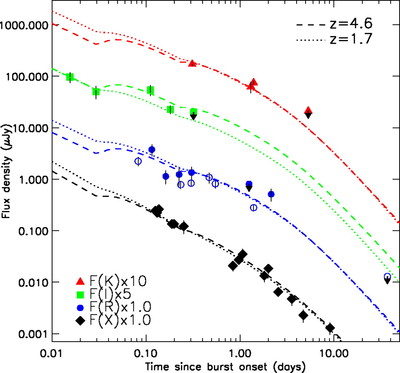
Caption: Fig. 2.
Light curve of the afterglow in the near‐infrared (K), visible (R and I), and X‐ray bands. The figure shows the result of the best fit of the model in the most probable high‐z (4.6) case, which has been optimized with values of ﹩p=2.06﹩, ﹩\theta _{0}=0\fdg 6﹩, and ﹩n=0.1﹩ cm−3, and in the low‐z (1.7) case, which gives a slightly worse fit with ﹩p=2.05﹩, ﹩\theta _{0}=2\fdg 3﹩, and ﹩n=0.04﹩ cm−3. The filled symbols are data presented in this article, whereas open symbols are data from the literature.
Other Images in This Article
Copyright and Terms & Conditions
© 2006. The American Astronomical Society. All rights reserved. Printed in U.S.A.
Copyright ©
2025 Astronomy Image Explorer. All Rights Reserved.