Image Details
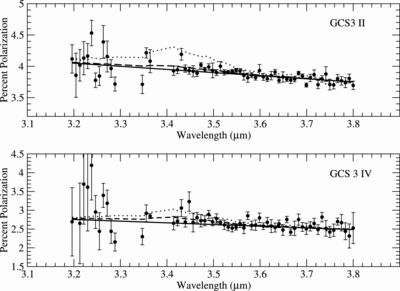
Caption: Fig. 1.
Polarization spectra of GCS 3‐II (top) and GCS 3‐IV (bottom). Observed polarization is shown by the filled circles with error bars. The estimated continuum polarization is shown by the solid line. The maximum allowed polarization, as determined from a χ2 fit in the 3.4 μm feature, is shown by the dashed line. The maximum polarization predicted for grains with organic mantles, assuming that ﹩\Delta p/ \tau ﹩ is the same as for the silicates, is shown by the dotted line.
Copyright and Terms & Conditions
© 2006. The American Astronomical Society. All rights reserved. Printed in U.S.A.
Copyright ©
2025 Astronomy Image Explorer. All Rights Reserved.