Image Details
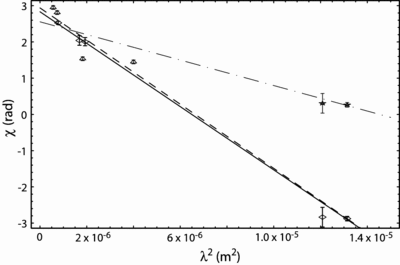
Caption: Fig. 1.
Mean polarization position angle of Sgr A* as a function of wavelength. The 85 GHz points have been derotated by −180°. Diamonds denote measurements for which polarization variability is detected, and their error bars denote the standard error of the mean of the p.a. variations. Triangles denote single‐epoch measurements only. The dashed line shows the best fit to all data, the solid line to all points excluding the Aitken et al. (2001) data, and the dot‐dashed line to the unwrapped 85 GHz points, denoted by stars.
Other Images in This Article
Copyright and Terms & Conditions
© 2006. The American Astronomical Society. All rights reserved. Printed in U.S.A.
Copyright ©
2025 Astronomy Image Explorer. All Rights Reserved.