Image Details
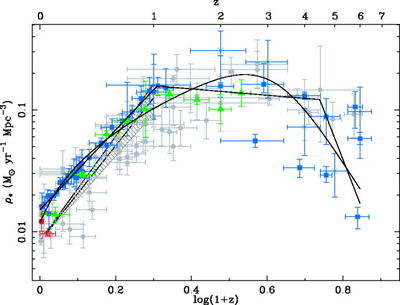
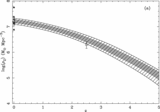
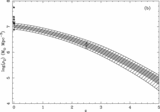
Caption: Fig. 1.
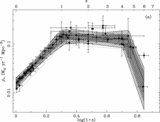
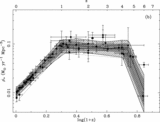
Evolution of SFR density with redshift. Data shown here have been scaled, assuming the SalA IMF. The gray points are from the compilation of Hopkins (2004). The hatched region is the FIR (24 μm) SFH from Le Floc’h et al. (2005). The green triangles are FIR (24 μm) data from Pérez‐González et al. (2005). The open red star at ﹩z=0.05﹩ is based on radio (1.4 GHz) data from Mauch (2005). The filled red circle at ﹩z=0.01﹩ is the Hα estimate from Hanish et al. (2006). The blue squares are UV data from Baldry et al. (2005), Wolf et al. (2003), Arnouts et al. (2005), Bouwens et al. (2003a, 2003b, 2005a), Bunker et al. (2004), and Ouchi et al. (2004). The blue crosses are the UDF estimates from Thompson et al. (2006). Note that these have been scaled to the SalA IMF, assuming they were originally estimated using a uniform Salpeter (1955) IMF. The solid lines are the best‐fitting parametric forms (see text for details of which data are used in the fitting). Although the FIR SFH of Le Floc’h et al. (2005) is not used directly in the fitting, it has been used to effectively obscuration‐correct the UV data to the values shown, which are used in the fitting. Note that the top logarithmic scale is labeled with redshift values, not ﹩( 1+z) ﹩.
Other Images in This Article
Show More
Copyright and Terms & Conditions
© 2006. The American Astronomical Society. All rights reserved. Printed in U.S.A.