Image Details
Caption: Fig. 2.
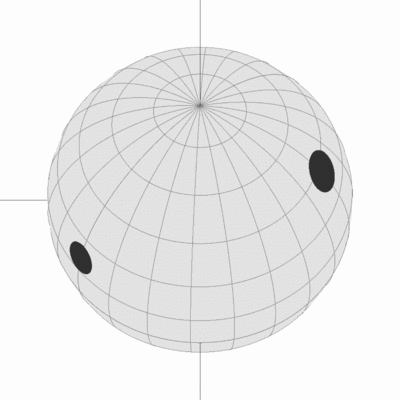
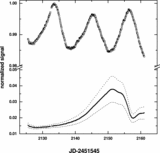
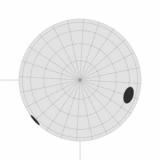
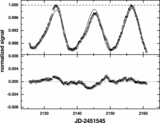
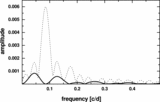
Top: ![]() Eri spots (Table 3) as seen from the line of sight (left) and the visible pole (right). Middle: The light curve of Fig. 1, with a linear trend removed. The solid line is the model from Table 3. The dashed line indicates the unspotted intensity of the star (﹩U=1.0000﹩). Bottom: Residuals from the model on the same scale.
Eri spots (Table 3) as seen from the line of sight (left) and the visible pole (right). Middle: The light curve of Fig. 1, with a linear trend removed. The solid line is the model from Table 3. The dashed line indicates the unspotted intensity of the star (﹩U=1.0000﹩). Bottom: Residuals from the model on the same scale.
Other Images in This Article
Copyright and Terms & Conditions
© 2006. The American Astronomical Society. All rights reserved. Printed in U.S.A.
Copyright ©
2025 Astronomy Image Explorer. All Rights Reserved.