Image Details
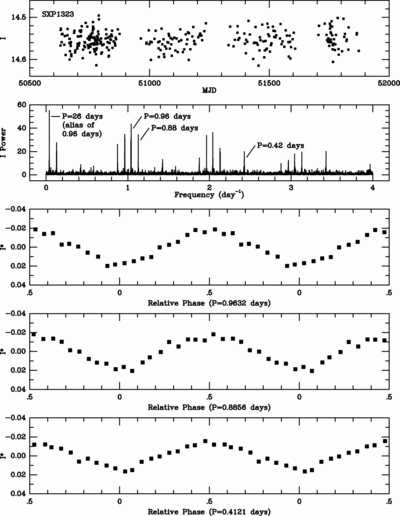
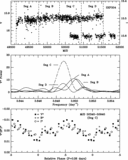
Caption: Fig. 6.
Top panel: Long‐term I light curve of RX J0103.6−7201 (SXP1323). Second panel: Periodogram of ﹩I^{*}﹩ data showing several significant periods and their aliases (see text). Third panel: ﹩I^{*}﹩ data folded on ﹩P=0.96﹩ days after signals from ﹩P=0.88﹩ and 0.42 days have been subtracted. Fourth panel: ﹩I^{*}﹩ data folded on ﹩P=0.88﹩ days after the variation of the other two NRPs has been subtracted. Bottom panel: Similar to the above two panels, but the ﹩I^{*}﹩ data have been folded on ﹩P=0.42﹩ days after subtraction of the variation due to the two other short periods.
Other Images in This Article
Copyright and Terms & Conditions
© 2006. The American Astronomical Society. All rights reserved. Printed in U.S.A.
Copyright ©
2025 Astronomy Image Explorer. All Rights Reserved.