Image Details
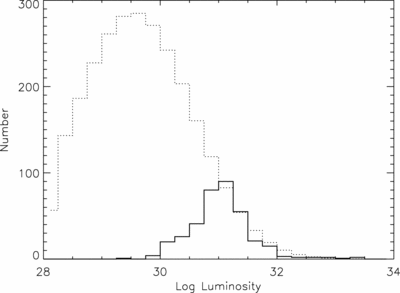
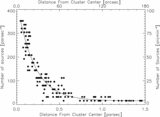
Caption: Fig. 11.
Histogram showing X‐ray luminosity distribution in RCW 38. The solid line shows the distribution of 365 candidate cluster members with spectral fits. The dotted line shows the expected full distribution of X‐ray luminosities assuming a lognormal distribution (after Feigelson et al. 2005).
Other Images in This Article
Show More
Copyright and Terms & Conditions
© 2006. The American Astronomical Society. All rights reserved. Printed in U.S.A.
Copyright ©
2025 Astronomy Image Explorer. All Rights Reserved.