Image Details
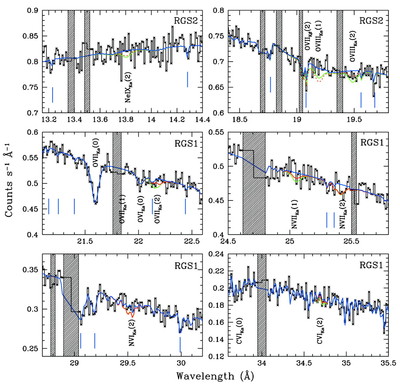
Caption: Fig. 1.
Portions of the XMM‐Newton RGS spectrum of Mrk 421 (black histogram). The continuum fit is shown by the solid blue line, the green line depicts the 2 σ upper limit on each measured species from XMM, and the red lines show the results of N05 (where their 3 σ upper limits are shown as dashed lines, while solid lines indicate best‐fit measurements). All N05 absorption‐line positions are labeled, with 1 and 2 denoting ﹩z=0.011﹩ and ﹩z=0.027﹩ lines, respectively. Significant ﹩z=0﹩ lines are included in the continuum fit for consistency and labeled 0, but they are not discussed further here. Regions that were excluded from the fit due to chip gaps and detector features are shaded; weaker instrumental features are marked with vertical blue ticks. Although joint fits using RGS1 and RGS2 were performed whenever possible, for display purposes only, one or the other (indicated in the upper right‐hand corner of each plot) is shown for each spectral region.
Other Images in This Article
Copyright and Terms & Conditions
© 2006. The American Astronomical Society. All rights reserved. Printed in U.S.A.