Image Details
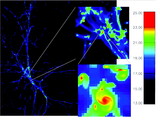
Caption: Fig. 4.
Top: Upper four solid lines show the H I column density frequency distribution ﹩f( N,X) ﹩ for runs C−1, C0, C1, and C2 (from thinnest to thickest line), all at ﹩z=3﹩. The lower two lines are the Γ function fits to the SDSS DLA survey data from Prochaska et al. (2005) for ﹩z=2.5{\mbox{--}} 3.0﹩ (dashed line) and ﹩z=3.0{\mbox{--}} 3.5﹩ (dotted line). Bottom: Same as top, except that the upper three lines give ﹩f( N,X) ﹩ for runs C1 (solid line), B1 (dashed line), and A1 (dotted line).
Other Images in This Article
Copyright and Terms & Conditions
© 2006. The American Astronomical Society. All rights reserved. Printed in U.S.A.
Copyright ©
2025 Astronomy Image Explorer. All Rights Reserved.