Image Details
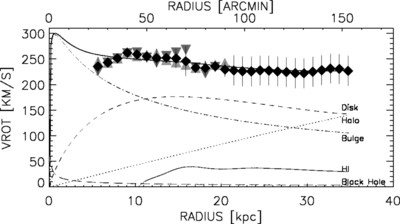
Caption: Fig. 2.
Rotation curve and mass model for M31. The new rotation velocities from the Effelsberg and GBT 100 m observations are for ﹩R> 21﹩ kpc. The velocities for ﹩R\leq 21﹩ kpc are recomputed from the Unwin (1983) H I data. The upward‐pointing triangles (light gray) are for the receding side, and the downward‐pointing (dark gray) ones for the approaching side, as obtained from a tilted‐ring model (see text). The solid line is the best fit to the data. Each mass component is identified. A mass of ﹩1.0\times 10^{8}\,M_{\odot }﹩ is used for the central black hole (Bender et al. 2005).
Other Images in This Article
Copyright and Terms & Conditions
© 2006. The American Astronomical Society. All rights reserved. Printed in U.S.A.
Copyright ©
2026 Astronomy Image Explorer. All Rights Reserved.