Image Details
Caption: Fig. 3.
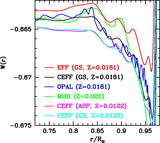
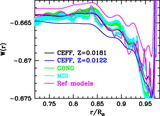
Average value of W(r) in three different radius ranges plotted as a function of Z for solar models with different equations of state and mixtures of heavy elements, as marked in the figure. The CEFF models with "other mixtures" include models constructed with the abundance of some individual elements increased by a factor of 2 over the GS value. These models are listed in Table 1. The reference and test models used in this study are also included in this figure. The continuous line is the best‐fit line through CEFF models of different Z, the dashed line is the best fit through OPAL models, and these lines are used to determine Z of the test models and the Sun using inverted ![]() W(r)
W(r)![]() .
.
Other Images in This Article
Copyright and Terms & Conditions
© 2006. The American Astronomical Society. All rights reserved. Printed in U.S.A.