

Image Details
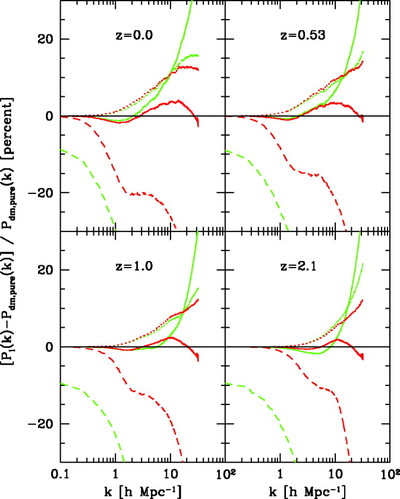
Caption: Fig. 2.
Influence of baryons on the clustering of each matter component. The plots show the relative percentage difference of the power spectrum of each matter component in the gas simulations relative to the pure dark matter simulation. The results of the nonradiative run are plotted in red, and those of the star formation run in green. The dotted lines, dashed lines, and solid lines are plotted for the dark matter and gaseous components and the total matter density field, respectively. The stellar component in the star formation run is omitted here, as the difference can be easily inferred from Fig. 1.
Other Images in This Article
Copyright and Terms & Conditions
© 2006. The American Astronomical Society. All rights reserved. Printed in U.S.A.

