Image Details
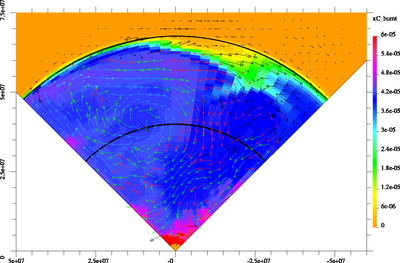
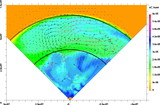
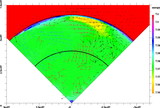
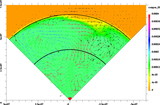
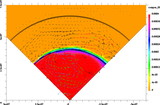
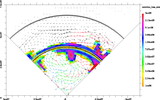
Caption: Fig. 3.
(a) Plot of the distribution of carbon‐burning products, velocity vectors, the Urca shell (black line around ﹩R=400﹩ km), and the boundary separating the inner region of constant entropy from the outer isothermal region (black line around 670 Km) for simulation S‐4‐2E4‐0 with no Urca process. The carbon‐burning products are distributed more or less evenly in the whole inner region. (b) Same as (a), but for simulation S‐4‐2E4 with the Urca process turned on. The carbon‐burning products are almost entirely confined to the inner zone (within the Urca shell). Strong convection is seen in the inner zone, and a separate convection region exists in the outer zone between the Urca shell and the boundary of the isothermal region, probably triggered by the overshoot from the inner zone. (c) Same as (b), but for simulation S‐1‐2E4 with smaller abundance of Urca‐active nuclei. The carbon‐burning products are less confined to the inner zone (within the Urca shell) than in (b). The velocities near the Urca shell are almost parallel to the shell. (d) Same as (b) and (c), but for simulation S‐0.4‐2E4, with even smaller abundance of Urca‐active nuclei. The carbon‐burning products are less confined to the inner zone (within the Urca shell) than in (c). Black arrows: Less than 1 km s﹩^{-1}﹩; red arrows: 1–2 km s﹩^{-1}﹩; green arrows: 2–4 km s﹩^{-1}﹩; blue arrows: 4–8 km s﹩^{-1}﹩.
Other Images in This Article


Copyright and Terms & Conditions
© 2006. The American Astronomical Society. All rights reserved. Printed in U.S.A.