Image Details
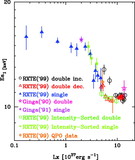
Caption: Fig. 7.
Eight intensity‐sorted spectra defined in Fig. 5, fitted with the NPEX×CYAB2 (f1–f5) or the NPEX×CYAB (f6–f8) model. The middle panels show the data‐to‐model ratios, while the bottom panels are the same ratios but without incorporating the CYAB factor(s).
Other Images in This Article

Show More
Copyright and Terms & Conditions
© 2006. The American Astronomical Society. All rights reserved. Printed in U.S.A.
Copyright ©
2025 Astronomy Image Explorer. All Rights Reserved.