Image Details
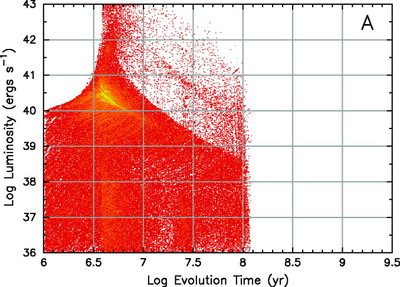
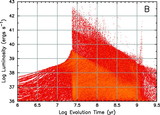
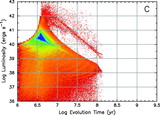
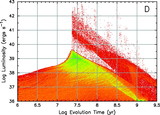
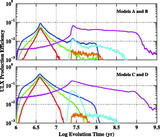
Caption: Fig. 1.
Simulated evolution of the X‐ray luminosity function of IMBH black hole binaries with time since the birth of the host star cluster. For each panel, evolution tracks from 30,000 X‐ray binaries were computed and then registered in each of the ﹩700\times 700﹩ pixels that are traversed. In the calculations used to produce these plots, the Eddington limit (at ~﹩2\times 10^{41}﹩ ergs s−1) was enforced; however, for clarity the LX values displayed here are without any Eddington limit. This affects only a relatively small fraction of the highest luminosity systems. The colors represent the square root of the relative populations, with red through blue corresponding to actual ratios of ~100–1. The distributions of initial masses and orbital separations for the four models are specified in Table 1.
Other Images in This Article
Copyright and Terms & Conditions
© 2006. The American Astronomical Society. All rights reserved. Printed in U.S.A.