Image Details
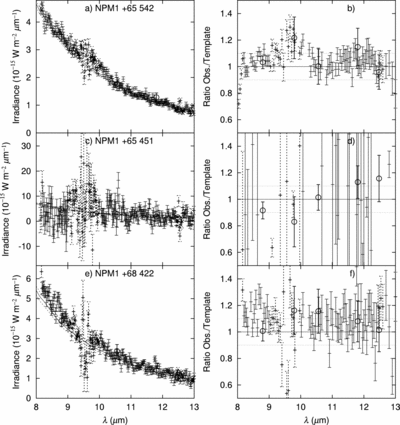
Caption: Fig. 3.
Comparison of the supertemplates and the observed spectra. The left panels present the observed spectra as ±1 σ length bars and the corresponding supertemplates as solid lines, with their ±1 σ bounds as dotted lines. The right panels show the ratios of the observed spectra to their supertemplates as ±1 σ error bars, where σ incorporates the random errors of the observations and the supertemplates in quadrature but does not include the absolute uncertainty. The open circles indicate the photometric data with the absolute photometric uncertainties. The resolutions of the spectra were reduced to match those of the supertemplates in the right panels. The dotted horizontal lines indicate 100% ± 10%. The regions of the spectra indicated by dotted lines show the spectral range in which the uncertainties are large because of the ozone and water vapor absorption features in the atmosphere. (a, b) NPM1 +65 542, (c, d) NPM1 +65 451, (e, f) NPM1 +68 422, (g, h) HD 238928, (i, j) HD 238803, and (k, l) NPM1 +64 504.
Other Images in This Article


Copyright and Terms & Conditions
© 2006. The American Astronomical Society. All rights reserved. Printed in U.S.A.