Image Details
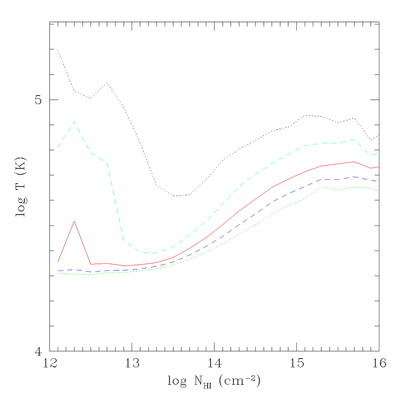
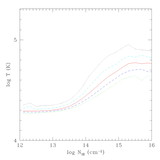
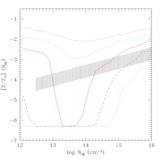
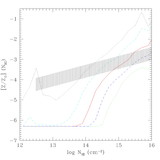
Caption: Fig. 4.
Temperature as a function of Lyα cloud column density for the two cases with (left; run 1: N432L11M) and without (right; run 2: N432L11L) GSWs, respectively, at ﹩z=3﹩. The five curves in each panel correspond to 10th, 25th, 50th, 75th, and 90th percentiles; i.e., 10% of the clouds have a temperature below the bottom curve, while 90% have a temperature below the top curve, etc.
Other Images in This Article
Show More
Copyright and Terms & Conditions
© 2005. The American Astronomical Society. All rights reserved. Printed in U.S.A.
Copyright ©
2025 Astronomy Image Explorer. All Rights Reserved.