Image Details

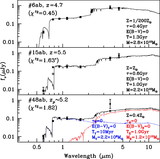
Caption: Fig. 3.
Spectra of the best‐fit models to the three IRAC‐detected ﹩z\approx 6﹩ objects. The parameters of these models are also labeled. The observed SEDs are plotted by filled squares with error bars. The model spectra are overplotted, and the synthetic model photometry integrated through the bandpasses is shown by open squares, which often overlap with the filled squares. While 7ab can be explained by single‐component models, both 1ab and 5abc require two‐component models. For these two objects, the templates of the evolved and the young components are shown by red and blue dashed lines, respectively, and their corresponding parameters are also labeled in red and blue.
Other Images in This Article

Copyright and Terms & Conditions
© 2005. The American Astronomical Society. All rights reserved. Printed in U.S.A.