Image Details
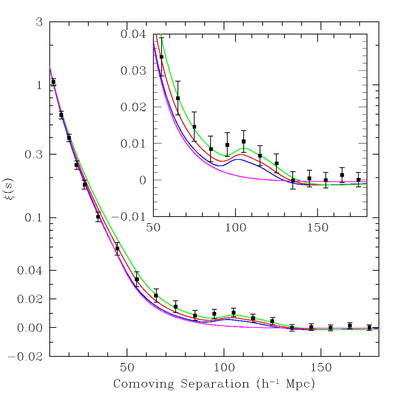
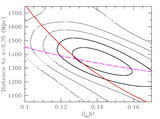
Caption: Fig. 2.
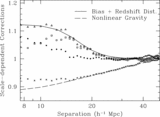
Large‐scale redshift‐space correlation function of the SDSS LRG sample. The error bars are from the diagonal elements of the mock‐catalog covariance matrix; however, the points are correlated. Note that the vertical axis mixes logarithmic and linear scalings. The inset shows an expanded view with a linear vertical axis. The models are ﹩\Omega _{m}h^{2}=0.12﹩ (green line), 0.13 (red line), and 0.14 (blue line), all with ﹩\Omega _{b}h^{2}=0.024﹩ and ﹩n=0.98﹩ and with a mild nonlinear prescription folded in. The magenta line shows a pure CDM model (﹩\Omega _{m}h^{2}=0.105﹩), which lacks the acoustic peak. It is interesting to note that although the data appear higher than the models, the covariance between the points is soft as regards overall shifts in ξ(s). Subtracting 0.002 from ξ(s) at all scales makes the plot look cosmetically perfect but changes the best‐fit χ2 by only 1.3. The bump at 100 h−1 Mpc scale, on the other hand, is statistically significant.
Other Images in This Article
Show More
Copyright and Terms & Conditions
© 2005. The American Astronomical Society. All rights reserved. Printed in U.S.A.