Image Details
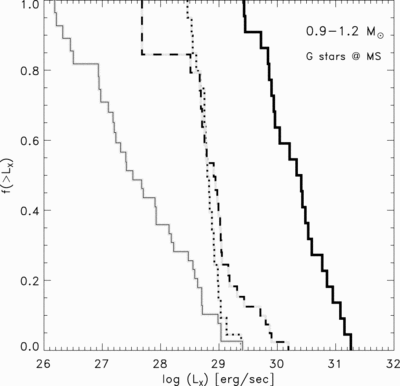
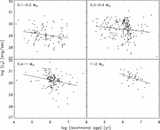
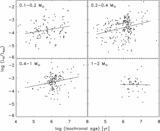
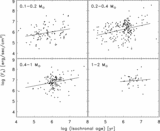
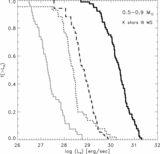
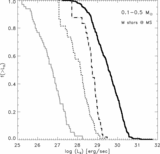
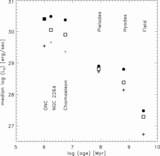
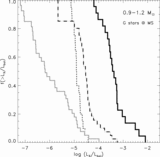
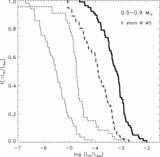
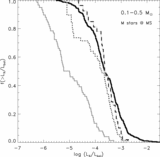
Caption: Fig. 4.
Evolution of the X‐ray luminosity from the pre–main sequence through the main sequence. The first three plots show the cumulative X‐ray luminosity functions (XLFs) for three mass ranges. In each panel, the thick solid line shows the COUP X‐ray luminosities for our ONC sample, the dashed line shows the Pleiades, the dotted line the Hyades, and the thin solid line the field stars from NEXXUS. The lower right panel shows the median X‐ray luminosity in each sample and mass range as a function of the age. The solid dots show the 0.9–1.2 M⊙ (G‐type on the main sequence) stars, squares show the 0.5–0.9 M⊙ (K‐type on the main sequence) stars, and crosses show the 0.1–0.5 M⊙ (M‐type on the main sequence) stars.
Other Images in This Article
Show More
Copyright and Terms & Conditions
© 2005. The American Astronomical Society. All rights reserved. Printed in U.S.A.