Image Details
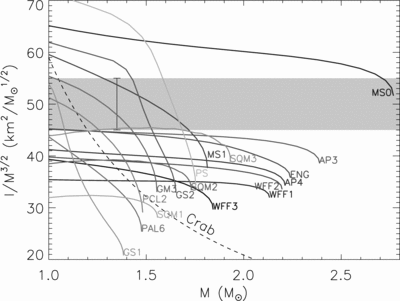
Caption: Fig. 1.
Moment of inertia scaled by ﹩M^{3/ 2}﹩ as a function of stellar mass M. Equation‐of‐state labels are described in Lattimer & Prakash (2001). The shaded band illustrates a 10% error on a hypothetical ﹩I/ M^{3/ 2}﹩ measurement of 50 km2 ﹩M^{-1/ 2}_{\odot }﹩; the error bar shows the specific case in which the mass is 1.34 ﹩M_{\odot }﹩. The dashed curve labeled "Crab" represents the lower limit derived by Bejger & Haensel (2003) for the Crab pulsar.
Other Images in This Article
Copyright and Terms & Conditions
© 2005. The American Astronomical Society. All rights reserved. Printed in U.S.A.
Copyright ©
2025 Astronomy Image Explorer. All Rights Reserved.