Image Details
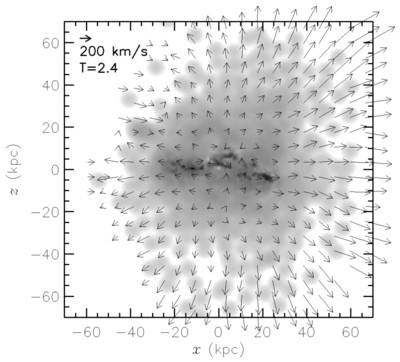
Caption: Fig. 1.
Velocity field of the gas overlaid on a gray‐scale map of the gas density in a 7 kpc slice through a plane perpendicular to the orbital plane at 2.4 Gyr after the start of the simulation and 200 Myr before the final merger. The length of the arrow in the top left corner represents 200 km s−1. From this view the coherent wind motion is clearly visible as it escapes the high‐density merging region out of the orbital plane, i.e., moving along the path of least resistance.
Other Images in This Article
Copyright and Terms & Conditions
© 2004. The American Astronomical Society. All rights reserved. Printed in U.S.A.
Copyright ©
2025 Astronomy Image Explorer. All Rights Reserved.