Image Details
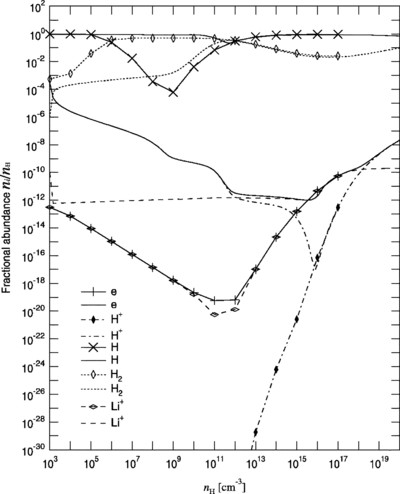
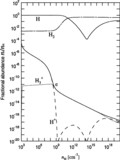
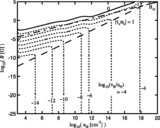
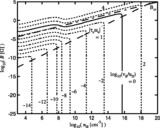
Caption: Fig. 5.
Fractions of various chemical species, after the time integration assuming fixed density and temperature over 103 Gyr, superimposed on Fig. 1. Curves with symbols represent the fractions after a long time integration, and the other curves represent the nonequilibrium fractions.
Other Images in This Article
Copyright and Terms & Conditions
© 2004. The American Astronomical Society. All rights reserved. Printed in U.S.A.
Copyright ©
2025 Astronomy Image Explorer. All Rights Reserved.